If you do not see the graphs, make the application window larger.
Use the Profiling build to measure the performance of different parts of Kanzi Engine. This build includes profiled Kanzi libraries.
The Profiling build comes with performance profiling categories and profilers that you can use to measure the performance of different parts of Kanzi Engine:
The startup performance profilers measure the time Kanzi Engine spends on different tasks during application startup. The startup performance profilers are registered in StartupProfilerRegistry. By default, all startup performance profiling categories are enabled. To set the state of a category in the application configuration, use the Configuration name. See ProfilingCategoryFilter.
This table lists the Kanzi startup performance profiling categories and profilers that are included in the Profiling build.
| Category | Configuration name | Profiler |
|---|---|---|
| Application initialization | StartupInitialization | m_initializationProfiler |
| Default resource registration | StartupRegisterDefaultResources | m_registerDefaultResourcesProfiler |
| Graphics initialization | StartupInitializeGraphics | m_initializeGraphicsProfiler |
| GL subsystem initialization | StartupInitializeGL | m_initializeGLProfiler |
| Startup kzb file opening | StartupOpenKzb | m_openKzbProfiler |
| Loading threads initialization | StartupInitializeLoadingThreads | m_initializeLoadingThreadsProfiler |
| Metadata registration | StartupRegisterMetadata | m_registerMetadataProfiler |
| Plugins loading | StartupLoadPlugins | m_loadPluginsProfiler |
| Prefabs loading | StartupLoadPrefab | m_loadPrefabProfiler |
| Prefabs instantiation | StartupInstantiatePrefab | m_instantiatePrefabProfiler |
| Prefabs attachment | StartupAttachPrefab | m_attachPrefabProfiler |
| Renderer reset | StartupResetRenderer | m_resetRendererProfiler |
| Runtime assets registration | StartupRegisterRuntimeAssets | m_registerRuntimeAssetsProfiler |
The main loop task performance profilers measure the time Kanzi Engine spends on different tasks on each iteration of the Kanzi main loop. The main loop task performance profilers are registered in the MainLoopTaskProfilerRegistry. By default, all main loop task performance profiling categories are enabled.
To set the state of a category in the application configuration, use the Configuration name. See ProfilingCategoryFilter.
This table lists the Kanzi main loop task performance profiling categories and profilers that are included in the Profiling build.
| Category | Configuration name | Title in HUD | Profiler |
|---|---|---|---|
| Animations Measures the time spent rendering animations. | MainLoopAnimation | Main loop: animation | m_animationProfiler |
| Application events handling Measures the time spent gathering and handling events from all available event sources, such as keyboard, mouse, and other available manipulators. | MainLoopApplicationEvents | Main loop: application events | m_applicationEventsProfiler |
| Application logic updating Measures the time spent inside the Application::update override that you provide. | MainLoopAppUpdate | Main loop: application update | m_appUpdateProfiler |
| User-provided application logic updating Measures the time spent executing the update logic callback Application::onUpdate that you provide. | MainLoopUserUpdate | Main loop: user update | m_userUpdateProfiler |
| Graphics events handling Measures the time spent processing events that affect graphics output, such as resizing a window. | MainLoopGraphicsEvents | Main loop: graphics events | m_graphicsEventsProfiler |
| Performance HUD Measures the overhead caused by rendering the information in the Performance HUD. | MainLoopHUD | Main loop: HUD | m_hudProfiler |
| Input events handling Measures the time that the InputManager spends processing input events, such as keyboard and mouse events. | MainLoopInput | Main loop: input | m_inputProfiler |
| Layout Measures the performance of the layout pass. | MainLoopLayout | Main loop: layout | m_layoutProfiler |
| Rendering Measures the time spent rendering the screen in Application::renderOverride. | MainLoopRendering | Main loop: rendering | m_renderingProfiler |
| Resource deployment Measures the time spent processing the asynchronous task deployment queue. | MainLoopResourceDeployment | Main loop: resource deployment | m_resourceDeploymentProfiler |
| Resource manager update Measures the time that the ResourceManager spends processing load and deployment queues. | MainLoopResourceManagerUpdate | Main loop: resource manager update | m_resourceManagerUpdateProfiler |
| Task dispatcher Measures the time spent executing tasks added to the task scheduler. | MainLoopTaskDispatcher | Main loop: task dispatcher | m_taskDispatcherProfiler |
| Task scheduler Measures the time spent executing periodic tasks added to the task dispatcher, such as animations. | MainLoopTaskScheduler | Main loop: task scheduler | m_taskSchedulerProfiler |
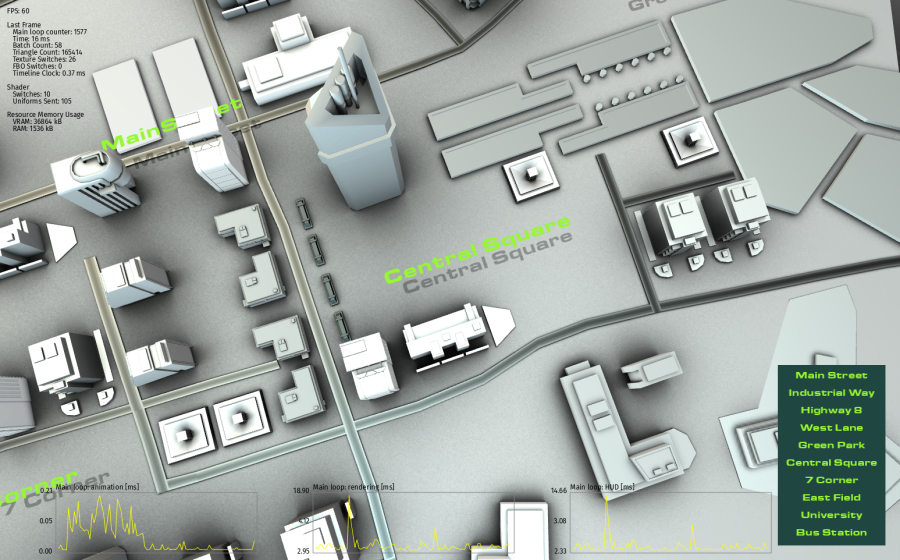
You can show performance measurement graphs in the Performance HUD for all main loop task performance profilers. See Showing performance measurement graphs in the Performance HUD.
You can show performance profiling graphs for the performance profilers which belong to a performance profiling category that is registered in the main loop task profiler registry MainLoopTaskProfilerRegistry. To access the main loop task profiler registry, use Domain::getMainLoopTaskProfilerRegistry.
This section explains how to show performance measurement graphs for the main loop task profilers included in the Profiling build. See Main loop task performance profiling categories.
You can show performance measurement graphs also for the main loop task profilers that you create to measure the performance of your application code. See Measuring the performance of custom main loop tasks.
To show performance measurement graphs in the Performance HUD:
PerformanceInfoLevel = 2
onConfigure() function:configuration.performanceInfoLevel = ApplicationProperties::PerformanceInfoLevelFull;
ProfilingCategoryFilter="MainLoopAnimation|MainLoopRendering|MainLoopHUD=show"
onConfigure() function:configuration.profilingCategoryFilter = "MainLoopAnimation|MainLoopRendering|MainLoopHUD=show";
performance_info.hpp header file.#include <kanzi/core.ui/application/performance_info.hpp>
onProjectLoaded function add:// Get the performanceInfo object. If the object does not exist, create it. PerformanceInfo& performanceInfo = acquirePerformanceInfo(); // Set the color of graph frames to gray. performanceInfo.setBorderColor(ColorRGBA(0.5f, 0.5f, 0.5f)); // Set the color of graph data to yellow. performanceInfo.setLineColor(ColorRGBA(1.0f, 1.0f, 0.0f)); // Set the color of text to black. performanceInfo.setFontColor(ColorRGBA(0.0f, 0.0f, 0.0f));
When you run the application, the Performance HUD shows the performance measurement graphs.
If you do not see the graphs, make the application window larger.
To analyze the performance of Kanzi Engine, log the performance profiling data.
You can use the Kanzi startup performance profilers in the Profiling build to measure the time Kanzi Engine spends on different tasks during application startup. See Startup performance profiling categories.
To log startup performance information, build your application using the Profiling build configuration.
For example, to build and run your application on Windows:
<MyProject>\Application\bin> ..\output\Win32\GL_vs2015_Profiling\MyApplication.exe > MyApplicationProfiling.log
Kanzi writes the startup performance measurement information to the log.
...
info:generic> Window 640x480
info:generic> Surface rgba8888 d24 s8 aa8 SwapBehaviorExchange
info:profiling> Startup profiling:
info:profiling> StartupInitialization                        283 611 688 ns
info:profiling> |-- StartupInitializeGraphics                234 791 513 ns
info:profiling> |-- StartupInitializeGL                              364 ns
info:profiling> |-- StartupInitializeLoadingThreads           46 897 986 ns
info:profiling> |-- StartupRegisterRuntimeAssets                 151 339 ns
info:profiling> |-- StartupLoadPlugins                               365 ns
info:profiling> |-- StartupRegisterMetadata                      455 476 ns
info:profiling> |-- StartupOpenKzb                               347 898 ns
info:profiling> StartupLoadPrefab                            467 833 692 ns
info:profiling> StartupInstantiatePrefab                       9 370 261 ns
info:profiling> StartupRegisterDefaultResources                   21 151 ns
info:profiling> StartupAttachPrefab                            6 404 379 ns
info:profiling> StartupResetRenderer                              64 911 ns
info:profiling> Startup profiling data logging took  83 145 ns
...
You can log data from specific profilers:
logAllData function.m_renderingProfiler:getDomain()->getMainLoopTaskProfilerRegistry().m_renderingProfiler->logAllData();
To log a summary of data from a profiler, use the logAggregateData function.
For example, to log a summary of data from the main loop animation profiler m_animationProfiler:
getDomain()->getMainLoopTaskProfilerRegistry().m_animationProfiler->logAggregateData();
You can log data from all profilers registered in a specific profiler registry by iterating through the profilers and calling the logAggregateData() or logAllData() function.
For example, to log a summary of performance profiling data from all main loop task profilers when exiting the application:
    // Kanzi calls this function when the application exits.
    virtual void onShutdown() KZ_OVERRIDE
    {
        // Get the main loop task profiler registry MainLoopTaskProfilerRegistry.
        const MainLoopTaskProfilerRegistry& mainRegistry = getDomain()->getMainLoopTaskProfilerRegistry();

        // Go through all profilers in the main loop task profiler registry and log their aggregate data.
        for (MainLoopTaskProfilerRegistry::ProfilerContainer::const_iterator
            profilerIter = mainRegistry.beginProfilers(),
            profilerIterEnd = mainRegistry.endProfilers();
            profilerIter != profilerIterEnd; ++profilerIter)
        {
            (*profilerIter)->logAggregateData();
        }
    }
Measuring application performance
Measuring the performance of your application code
